For a journalist wanting to get start using satellite data in their reporting, the wealth of options can be overwhelming. There is an increasing amount of satellite data openly available, and figuring out how it might fit into a story is often a challenge.
Based on a sample of over fifty stories, I’ve identified nine categories that sum up the most common uses of satellite data in journalism. These categories are not always mutually exclusive — in some cases there is some overlap. But broadly each category represents a specific use for this type of data.
Here’s each category explained:
Before/after
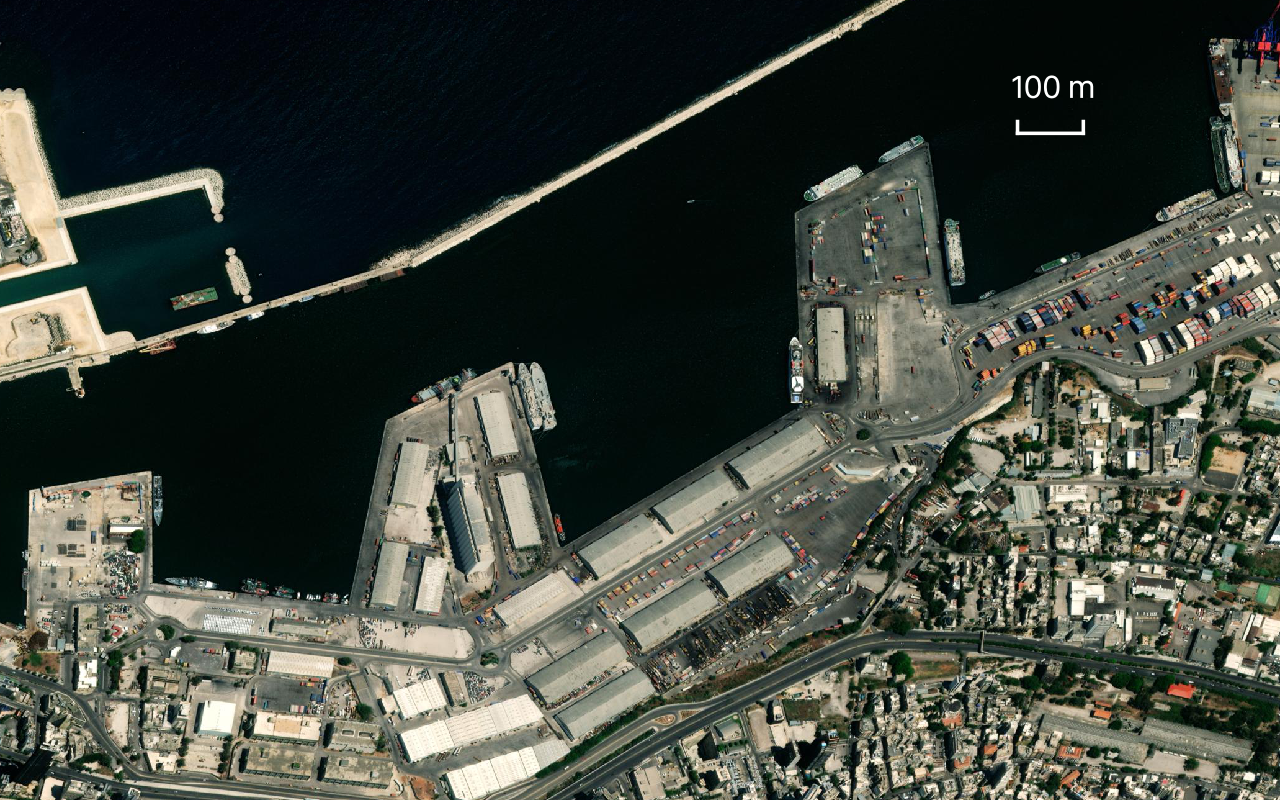
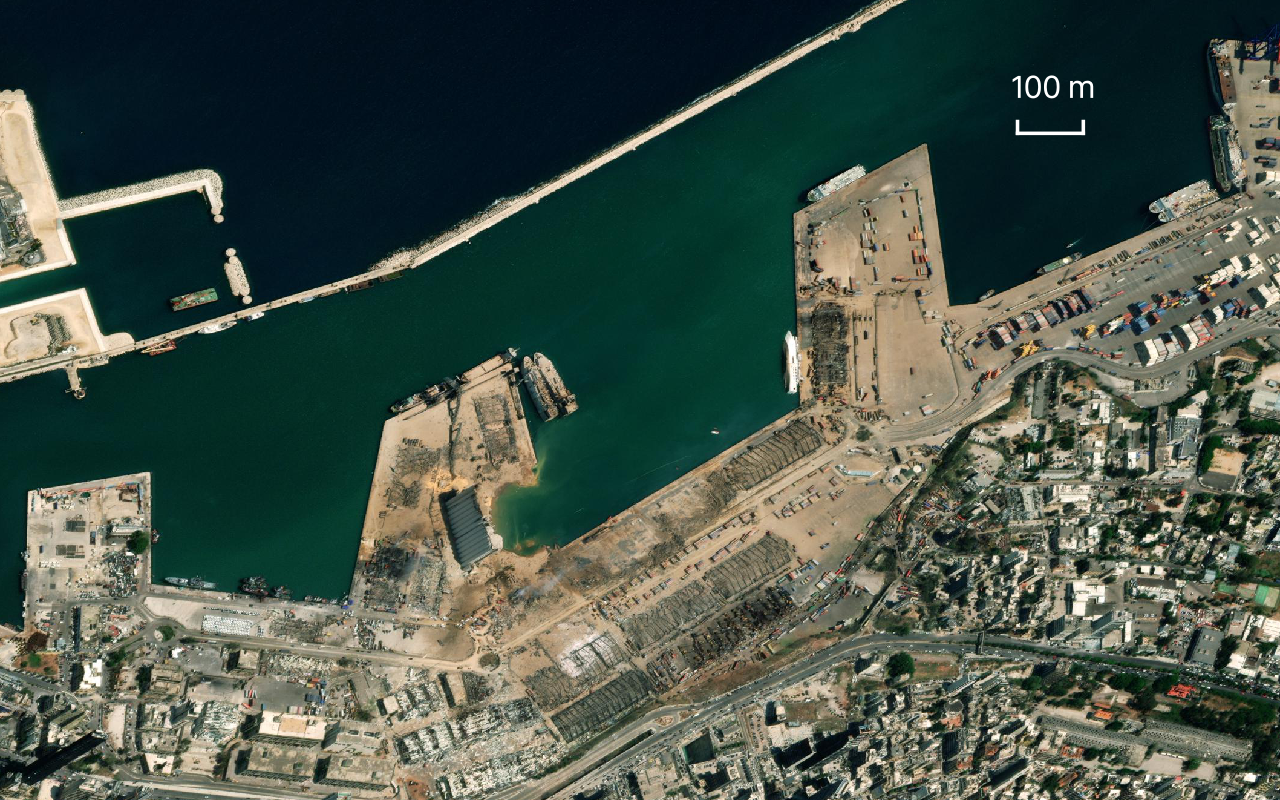
A commonly seen application of satellite data is the before/after image combination. Through initiatives like Maxar’s Open Data Program, images from before and after major crisis events will often be freely distributed to the press.
The images that Maxar released from around the time of the Beirut port explosion show the immense scale of the blast.
Geolocation
Finding the location where an image or video was captured often relies on identifying landmarks and natural features of the landscape and matching those to satellite photos. In the open-source intelligence (OSINT) community, this process is called geolocation.
BBC Africa Eye used this technique to pinpoint the location of a video showing two women and two young children being shot by a group of Cameroonian soldiers. The government of Cameroon initially dismissed the video as ‘fake news’, but with the help of Bellingcat and other online investigators, the BBC was able to prove exactly where it happened. This ultimately led to the prosecution and conviction of the soldiers responsible for the killing.
Smoking gun
If you’ve watched too many spy movies, you might think that using satellite imagery is all about tracking down bad guys at the click of a button. In reality, finding the so-called ‘smoking gun’ is quite rare. And this makes sense if you think about it. The highest resolution commercial satellite imagery available today is 30cm per pixel. While this allows you to identify buildings and vehicles — it isn’t nearly enough to identify a person.
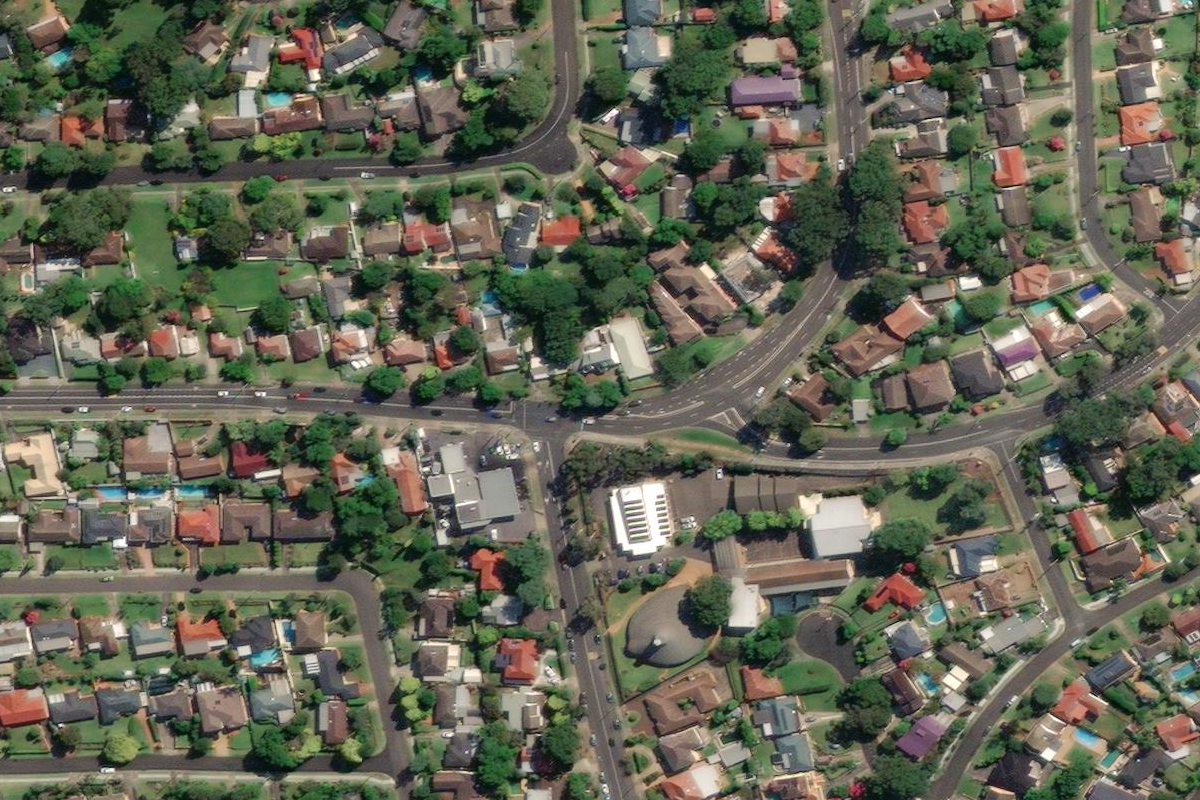
High-resolution satellite image (30cm). Source: Maxar.
Nonetheless, sometimes reporters do manage to find that crucial piece of evidence using satellites. In an investigation carried out by The Associated Press, reporters were able to get a satellite photo of a rendezvous between two fishing trawlers and a cargo vessel, which was the missing link they needed to prove widespread slavery in the fishing industry.
Verification/reconstruction
Satellite imagery can also be useful in reconstructing newsworthy events, or verifying they even happened at all. Think of checking whether an oil spill occurred, after reports of a pipeline being sabotaged for example. If the oil spill is large enough, it should show up on satellite photos.
When a Ukrainian passenger plane was shot down over Iran, the New York Times Visual Investigations team used satellite photos to reconstruct the events that unfolded that night. They also used geolocation to verify that videos that showed up on social media were indeed from the incident. In a behind-the-scenes video, the team explains how that story came together.
Presence/absence
Showing whether something is present or absent — sometimes that’s all a story needs. If the scale of what you’re trying to show is large enough to be seen from space, then satellite imagery is your friend.
The Covid-19 pandemic might not seem like the ideal topic to be covered from space, but it turns out that the absence of traffic and crowds in March of last year was so significant that it was picked up by satellites.
A piece by the Reuters Graphics team highlights the presence of Chinese ships in Taiwanese coastal waters. It illustrates how China has launched a campaign of so-called grey-zone warfare against Taiwan.
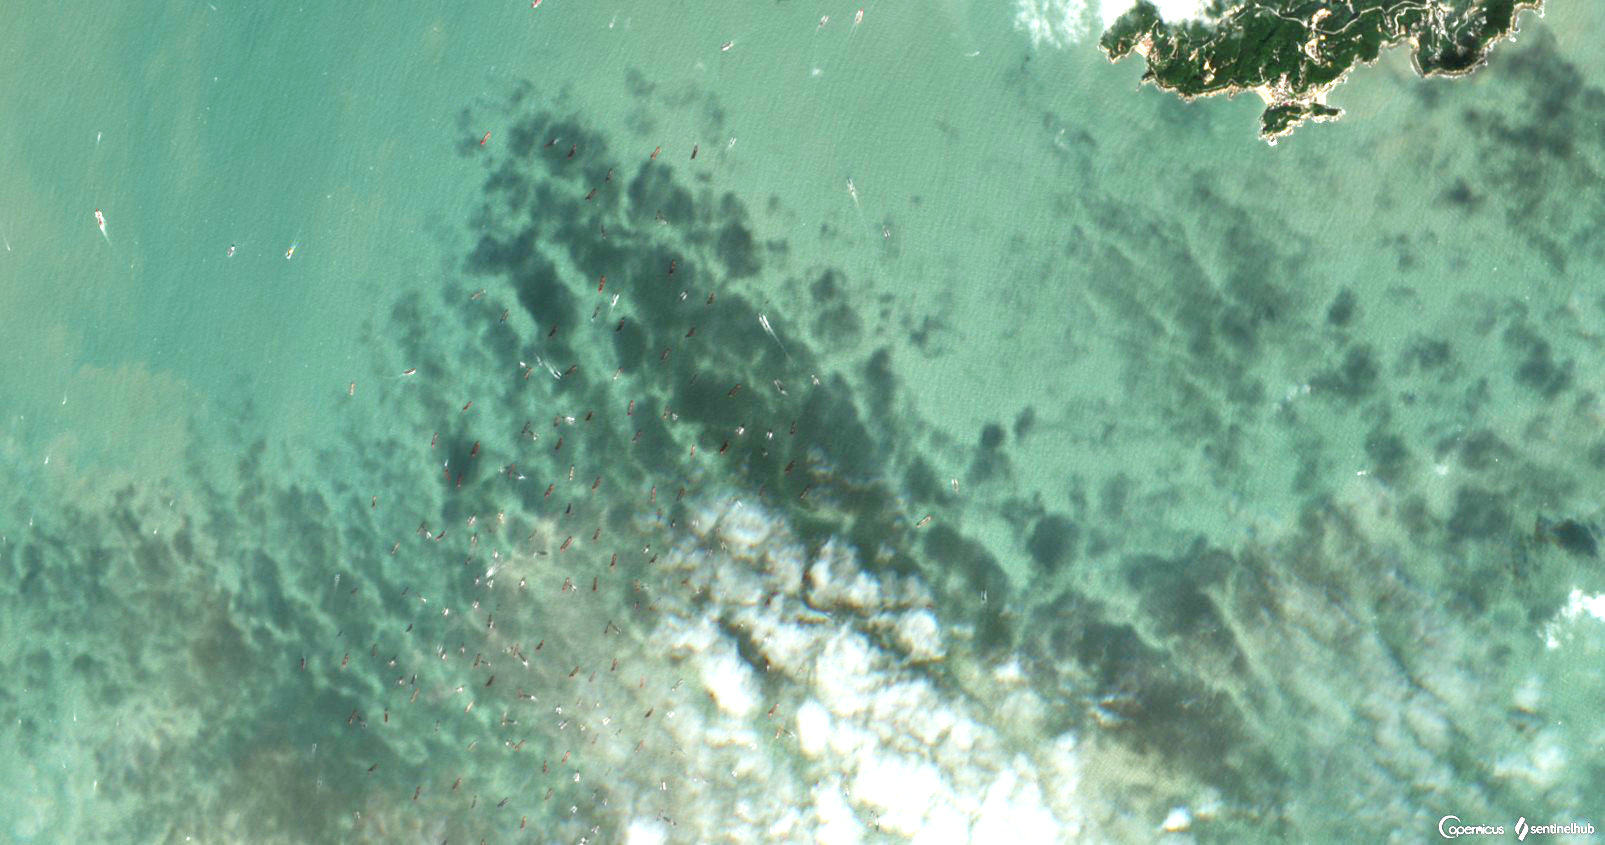
Image captured by ESA’s Sentinel-2.
Comparison
Satellite data can be used to compare different areas on things like air pollution, vegetation cover, or urban density. This works well for situations where you might expect similar values across regions.
Mapping city lights at night can also reveal interesting patterns. Data captured using NASA’s Suomi NPP satellite shows the difference between North Korea and South Korea — with the former mostly covered in darkness.
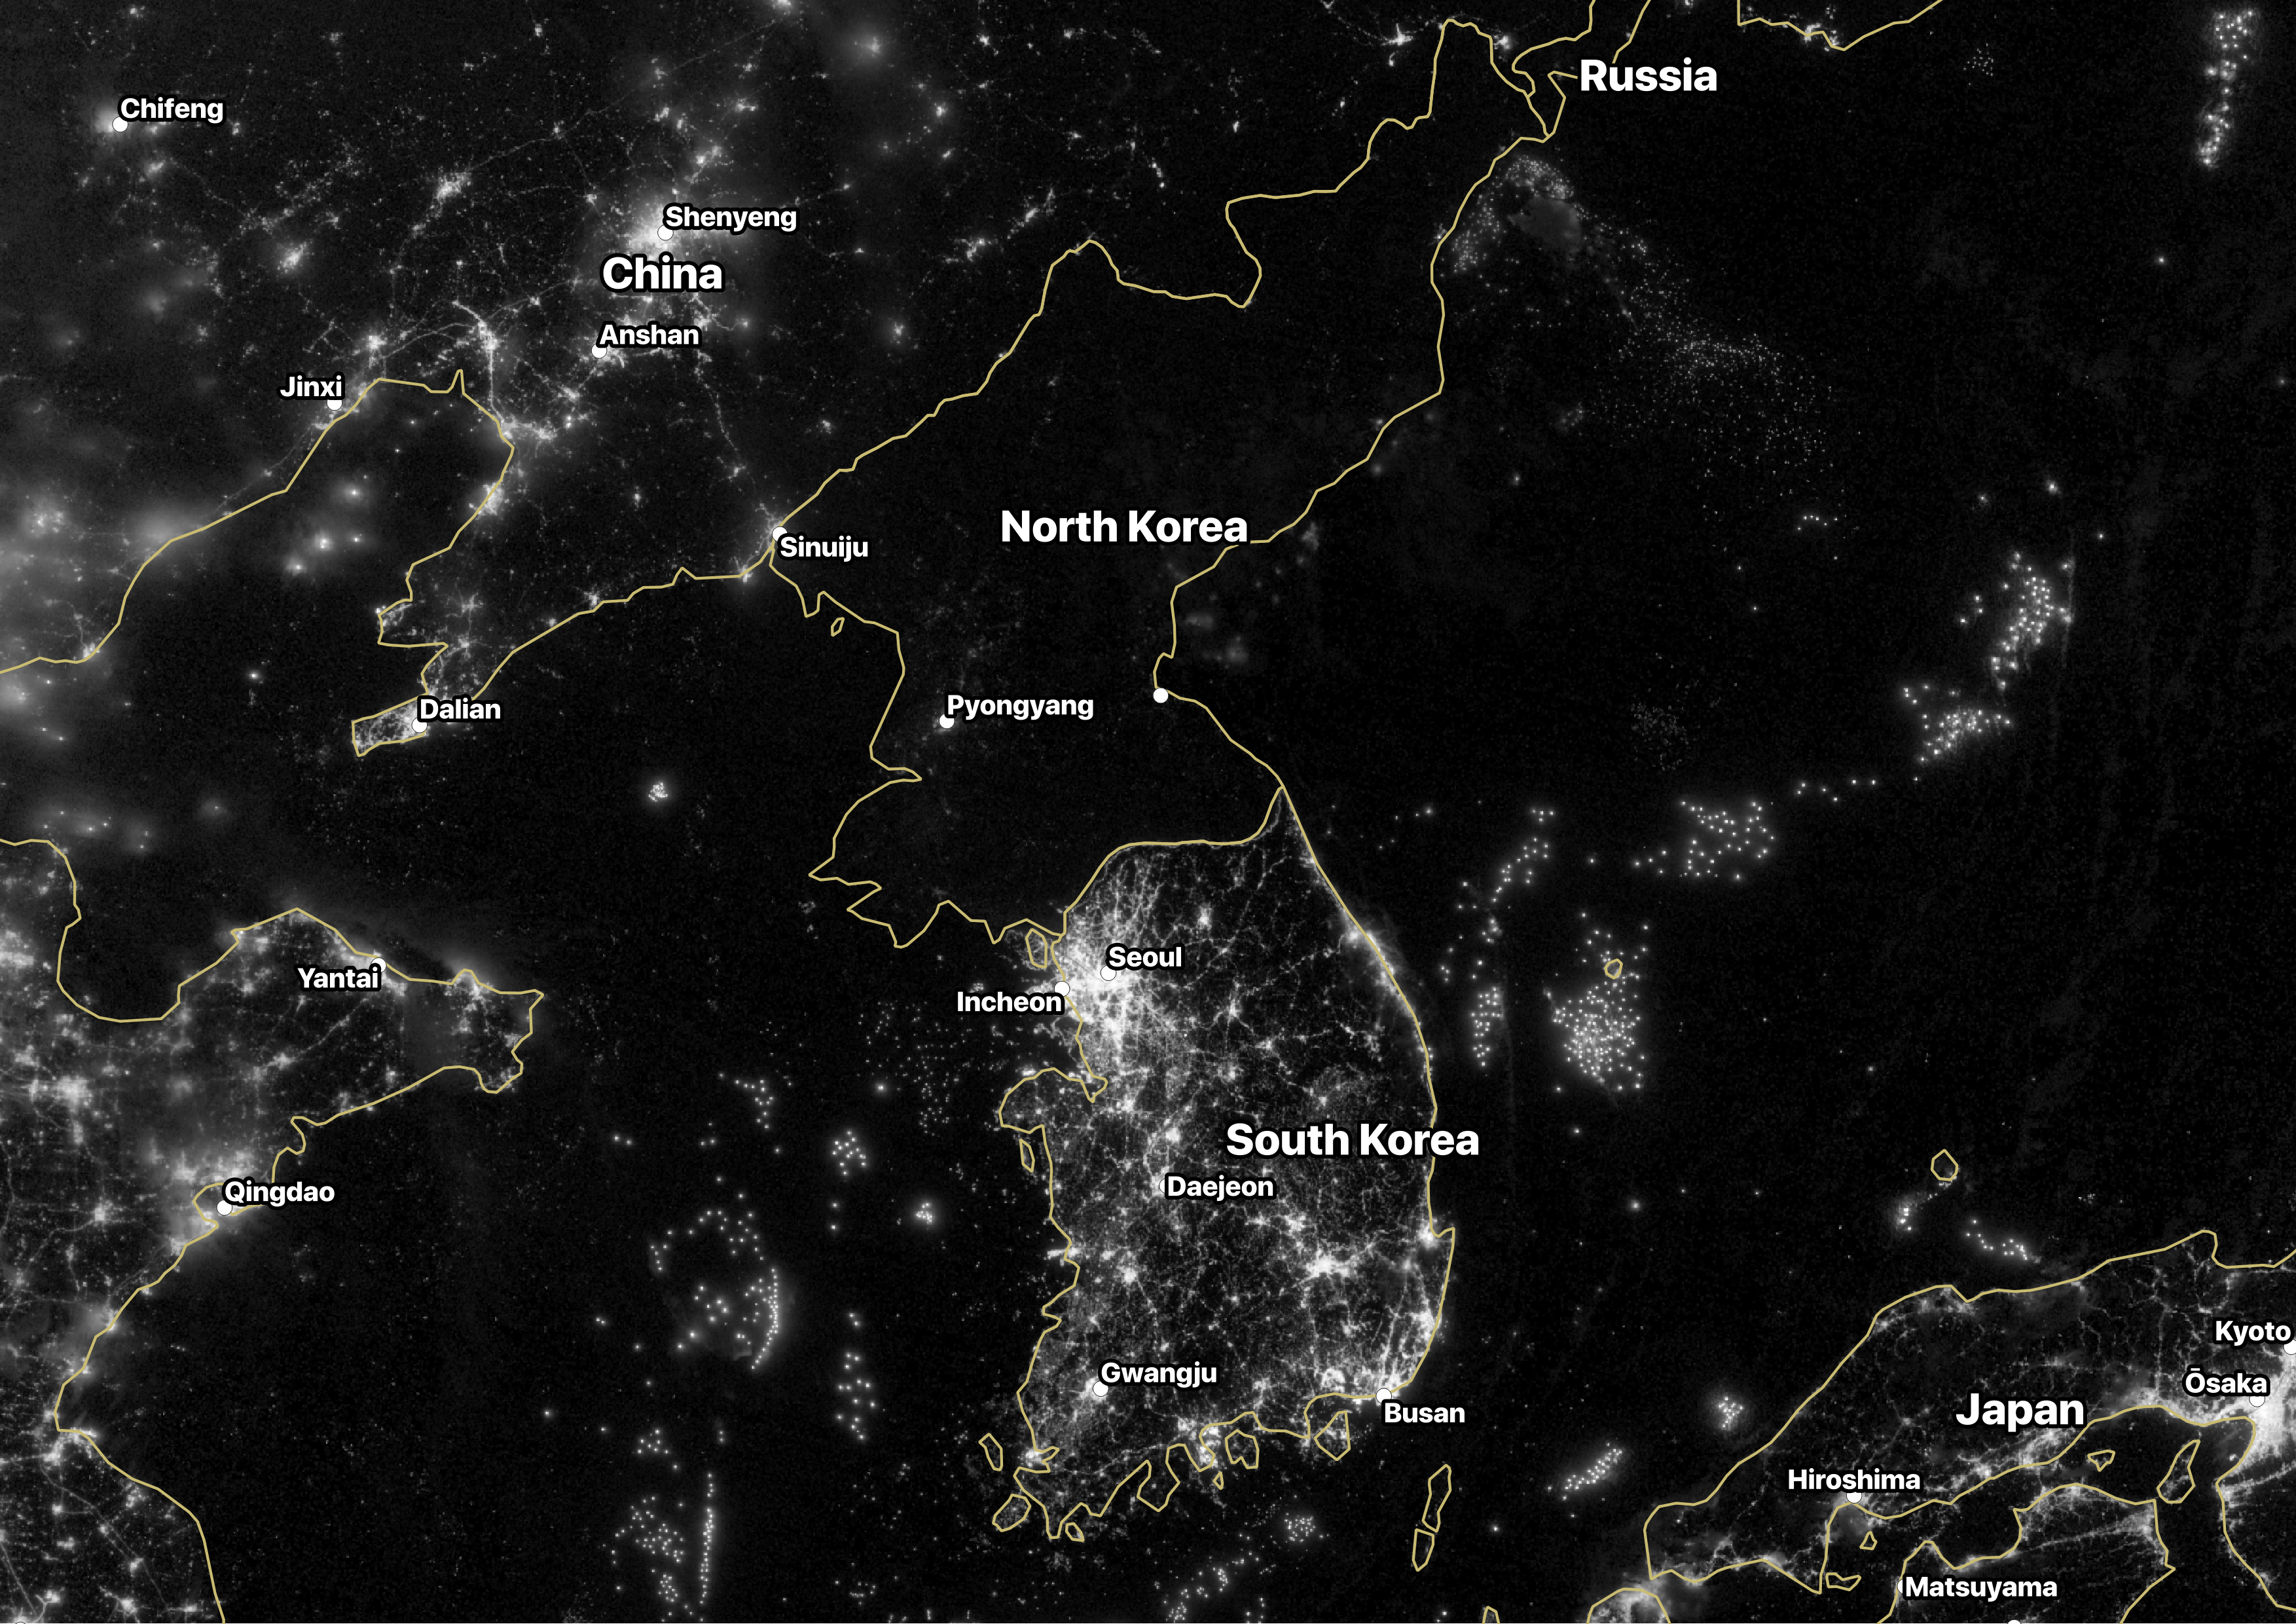
Nighttime view of the Korean Peninsula, captured by NASA’s Suomi NPP satellite (September 24, 2012).
Illustration/scale
In many cases, satellite images are used in the same way that any photograph might be used to accompany a news report. Sometimes space just offers the best vantage point.
When an iceberg roughly the size of Mallorca breaks off from an ice shelf in Antarctica, there aren’t many alternatives for getting a good photo. The location is extremely remote, and the iceberg is so large you need to be in orbit to get a good view of it.
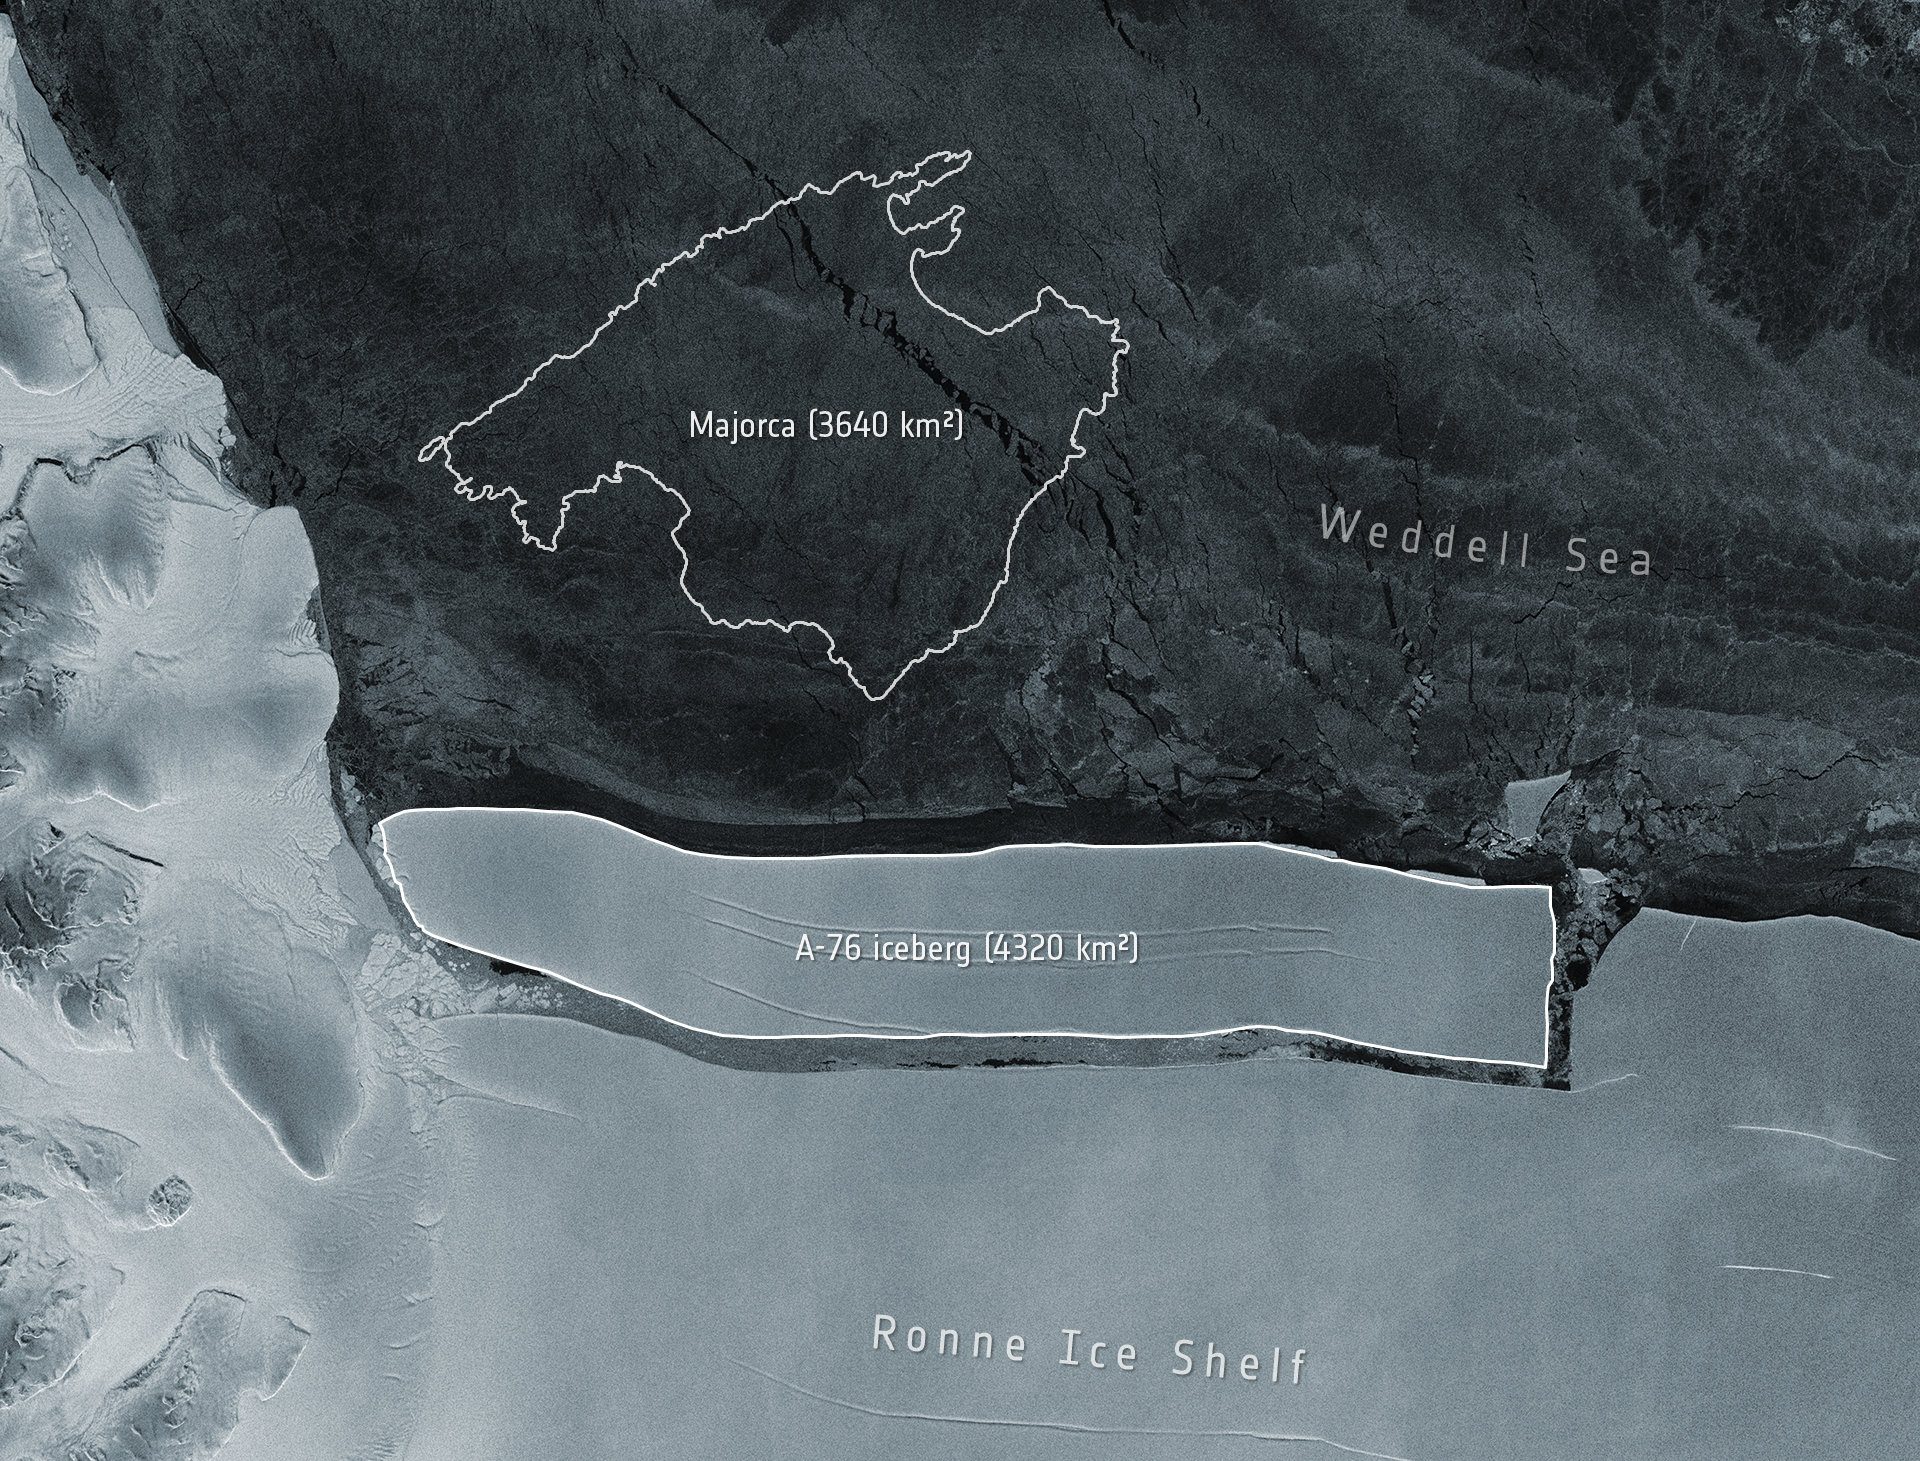
Copernicus Sentinel data (2021) / European Space Agency
Another example is the incident where a giant ship got stuck in the Suez Canal. Satellite photos showed how the ship was lodged in between the two sides of the canal, and it highlighted the vessel’s size in comparison to the size of the waterway.
Mapping environmental impact
From tracking deforestation to mapping wildfires, measuring environmental impact is an area to which satellite data lends itself particularly well. Most uses of satellite data in journalism rely on true-colour images. These are images that combine red, green and blue sensor data to represent the world as we normally see it.
Many satellites, however, have sensors that pick up light from outside the visible spectrum, such as infrared. And others use radar imaging to create a representation of the world.
This type of data isn’t always useful to journalists, but it is when it comes to the environment. It also opens up many more data sources to discover. One example is data from geostationary satellites, such as NASA’s GOES satellite network. Geostationary satellites move in an orbit around the equator at the same speed of the earth’s rotation — so to someone on earth, they appear to be stationary in the sky.
Because these satellites are further away from the earth than other satellites, they are uniquely suited to capture data on entire countries, or even continents. This allows journalists to do things like mapping how the smoke from wildfires spreads over the United States.
Mapping infrastructure changes
With today’s high-resolution satellite imagery, it is possible to detect and track changes to human-built infrastructure. In hard-to-reach areas, or places that ban journalists from entering, this might be the only way to find out what’s happening on the ground.
The BBC was one of the first to report on the system of internment camps that is used to imprison Muslim minorities in China’s Xinjiang region. Using Sentinel-2 imagery, they were able to show how quickly these camps were being developed.
This work was later expanded on by others. Reporters at BuzzFeed used satellite imagery to identify hundreds of detention facilities in the region.
Their breakthrough came when they noticed that some map tiles in the vicinity of known camps did not show up on the Chinese mapping platform Baidu. By looking for other blank spots on the map, they were able to identify more camps.
With more than 380 known facilities, the Australian Strategic Policy Institute currently holds the most complete database of detention facilities in Xinjiang. Many of them were found using satellite imagery analysis.
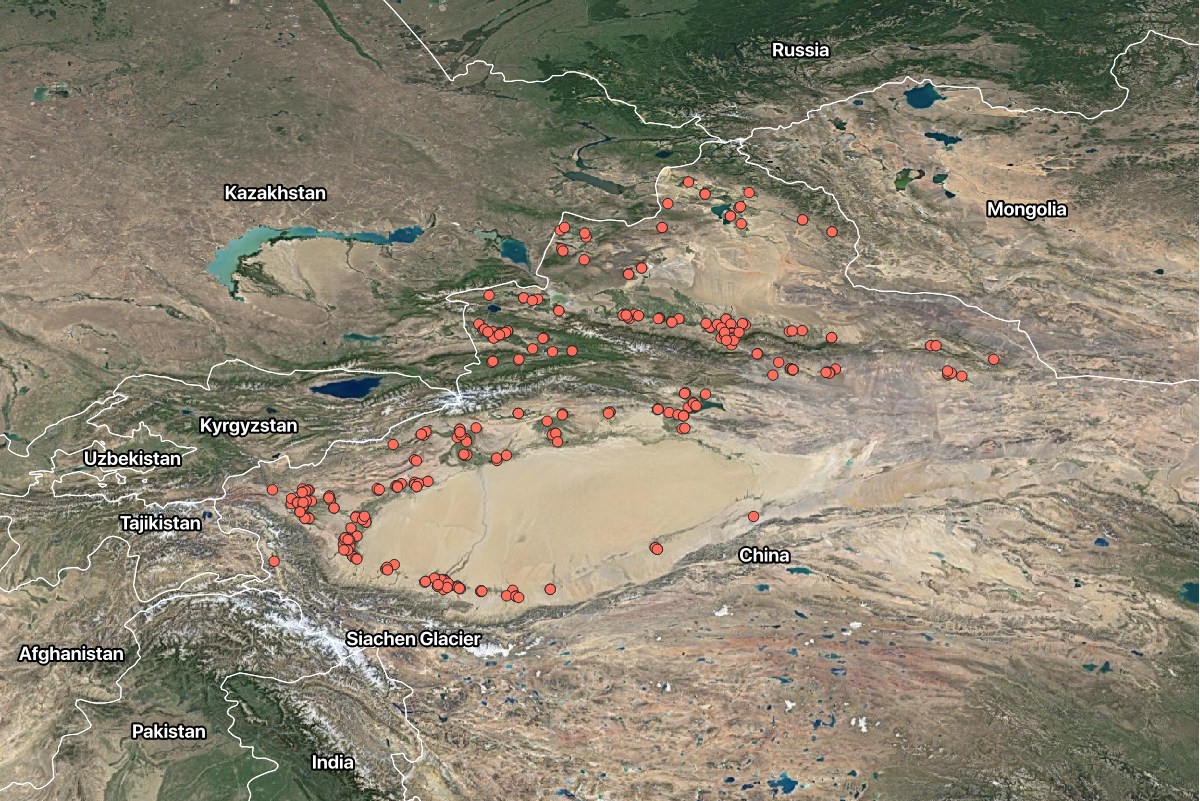
Camp locations identified by the Australian Strategic Policy Institute.
Have you spotted another use of satellite data in reporting? Please reach out to me on Twitter.